Atmospheric CO2 Concentrations
only zero carbon only zero carbon only zero carbon only zero carbon only zero carbon only zero carbon only zero only zero
Only zero carbon emissions can result in the stabilization of atmospheric CO2
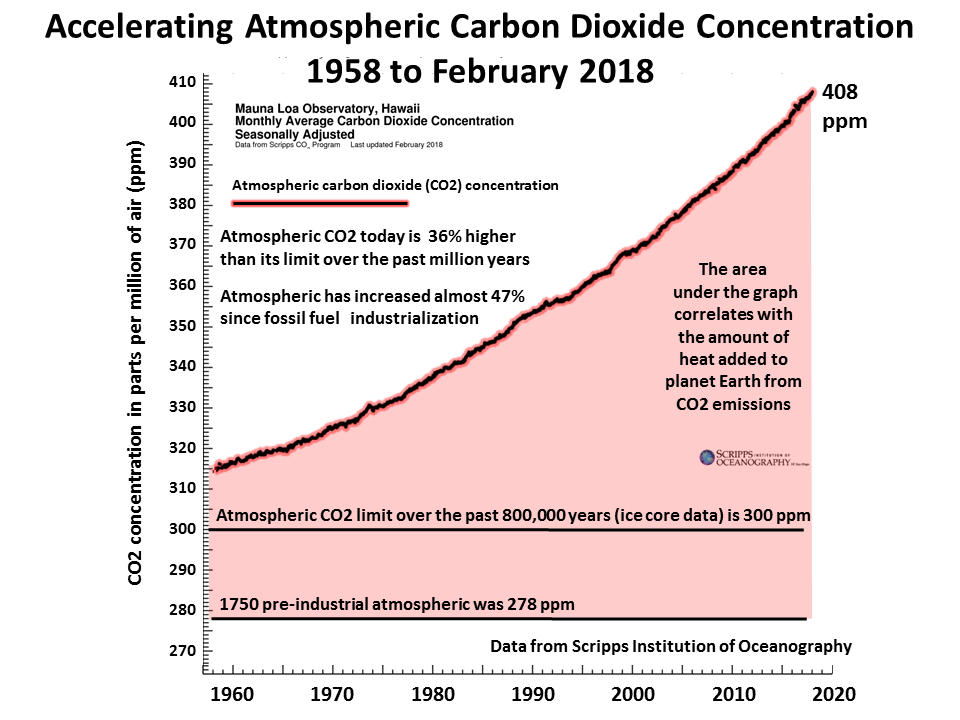
The GCP is the recognized international resource for CO2 emissions sinks and sources. In the annual GCP Global Carbon Project the atmospheric concentration of CO2 is included. The increase in atmospheric C02 is accelerating.
The World Meteorological Organizations publishes the annual Greenhouse Gas Bulletin
The NOAA Annual Greenhouse Gas Index shows that from 1990 to 2010 radiative forcing by long-lived greenhouse gases increased by 29%, with CO2 accounting for nearly 80% of this increase.
The NOAA Annual Greenhouse Gas Index shows that from 1990 to 2010 radiative forcing by long-lived greenhouse gases increased by 29%, with CO2 accounting for nearly 80% of this increase.
For about 10 000 years before the industrial revolution, the atmospheric abundance of CO2 was nearly constant at ~ 280 ppm (ppm = number of molecules of the gas per million molecules of dry air). This level represented a balance among the atmosphere, the oceans and the biosphere.
Since 1750, atmospheric CO2 has increased by 38%, primarily because of emissions from combustion of fossil fuels (8.7Gt carbon in 2008, http:// www.globalcarbonproject.org/), deforestation and land- use change.
High-precision measurements of atmospheric CO2 beginning in 1958 show that the average increase in CO2 in the atmosphere (airborne fraction) corresponds to ~55% of the CO2 emitted by fossil fuel combustion. The remaining ~45% has been removed from the atmosphere by the oceans and the terrestrial biosphere. The airborne fraction of CO2 varies inter annually, without a confirmed global trend.
Globally averaged CO2 in 2010 was 389.0 ppm and the increase from the previous year was 2.3 ppm (Figure 3). This growth rate is higher than the average for the 1990s (~1.5 ppm/yr) and the average for the past decade (~2.0 ppm/yr).
Globally averaged CO2 in 2010 was 389.0 ppm and the increase from the previous year was 2.3 ppm (Figure 3). This growth rate is higher than the average for the 1990s (~1.5 ppm/yr) and the average for the past decade (~2.0 ppm/yr).
The Cabon Dioxide Information Analysis Center at the US Oakridge National Lab provides very detailed CO2 information.
Its FAQ page (link above)is a good source of general CO2 information
CO2.Earth (used to be CO2now) publishes the NOAA atmospheric CO2
This the quickest way to access the latest CO2 concentration.
Atmospheric CO2 Past 260 years
Past 1000 years
Past 800,000 years
The atmospheric CO2 concentration has increased 40% since industrialization.
It is now:
40% higher than the pre industrial level of 280ppm and
30% higher than the past 800,000 year limit of 300ppm.
The same applies for ocean acidification.
Atmospheric CO2 would much higher if CO2 had not dissolved 30% of post industrial emissions.
CO2 in the atmosphere absorbs and (re-)radiates infra red heat in the lower atmosphere warming the surface of the planet and upper ocean waters.
CO2 is highly cumulative because 20% of emissions last for 1000 years in the atmosphere.
The more CO2 builds up in the atmosphere the more heat will be in the lower atmosphere, the more heat will build up in the oceans and the more the oceans will be acidified.
Today's CO2 from CO2. Earth
Past 8,000 years

Click for l est level

Atmospheric CO2 concentrations

The World Meteorological Organizations publishes an annual Greenhouse Gas Bulletin: The State of Greenhouse Gases in the Atmosphere
Based on Global Observations through 2010 (see below)
Based on Global Observations through 2010 (see below)
The rate of increase in atmospheric CO2 is unprecedented (IPCC 2007)
Its concentration(2018 408 ppm) is 36% higher that the 800,000 ice core maximum of 300 ppm.
Atmospheric CO2 reaches 400 ppm Feb 2015, highest in millions of years possibly 15-20 million years
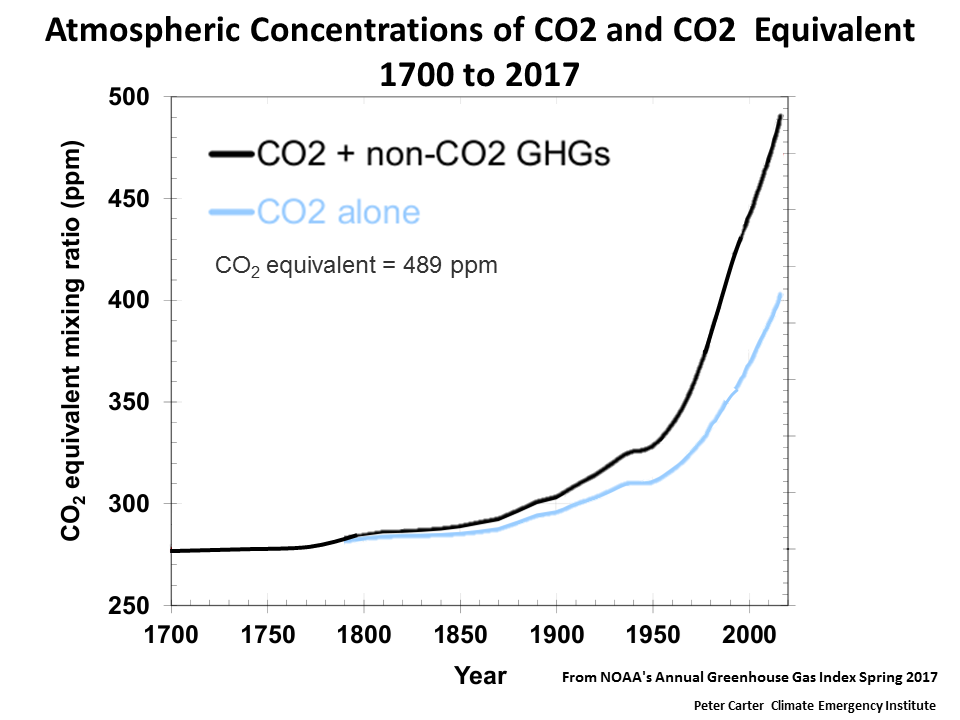
Climate science uses two types of CO2 concentrations- CO2 ppm just CO2 and CO2 equivalent (CO2e or CO2eq). CO2 equivalent adds in the other main GHGs.
The issue gets complicated and confusing because some scientists also add in the cooling effect of air pollution aerosols. Here we are just looking at CO2.
CO2 equivalent (CO2 eq. or CO2 e.) adds in the other GHGs, most importantly methane and nitrous oxide, as well as surface ozone and halo-carbons. see Equivalent CO2 and its use ..
2014 IEA Energy Stats 1971-2012
Presentation
Presentation
VIDEOanimation
New York City's greenhouse gas emissions as one-ton spheres of carbon dioxide gas
New York City's greenhouse gas emissions as one-ton spheres of carbon dioxide gas


Global Carbon Project Interactive Carbon Atlas
Animation 80,0000 years of atmospheric CO2
2015 and 2016 had the highest the atmospheric CO2 concentrations by far and the biggest increase in one year (3ppm) (boosted by the El Nino)
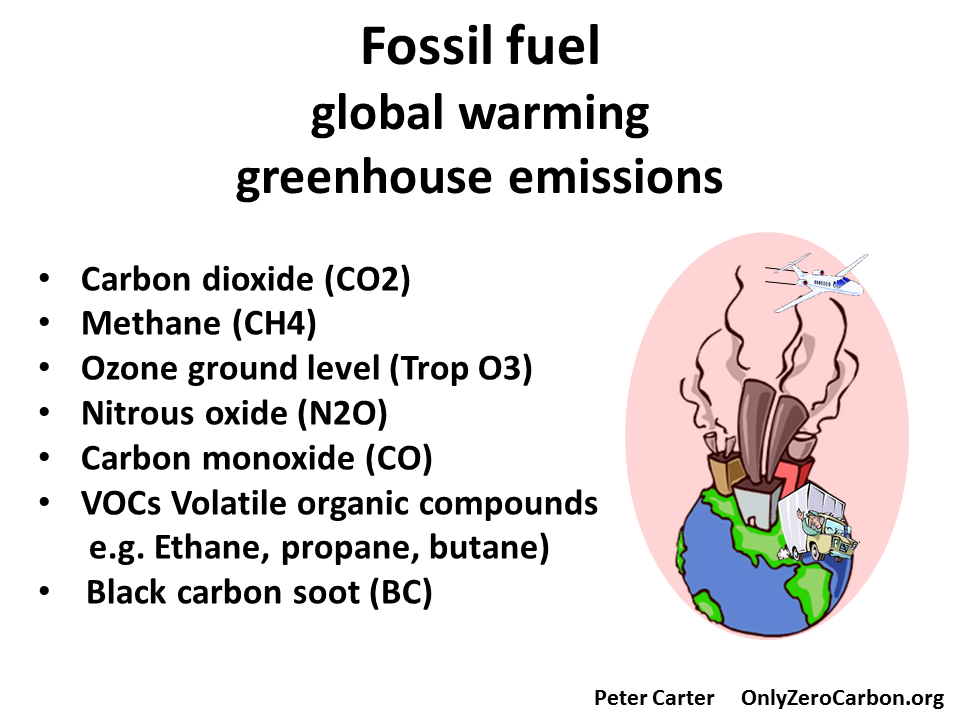
Fossil fuel combustion is by far the top source of CO2 emissions, and is also a source of other global warming emissions (methane, nitrous oxide, surface ozone).